Artem Voloskovets
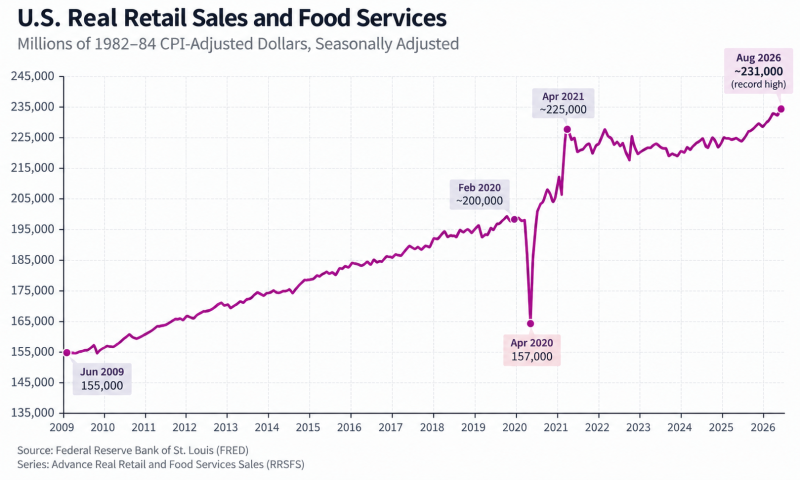
The data are less extreme when the economist accounts for the impact of inflation. Real retail and food service sales grew by 0.8% since July and by 2.6% compared to the previous year. To be specific those transactions reached a total of approximately $231 billion when measured in dollars adjusted by the Consumer Price Index from 1982 - 1984. It is a value that is higher than any previously recorded measurement for this category.
Economist E.J. Antoni highlights a much longer-term comparison: despite the record, August real sales were only 1.4% above April 2021. That means almost all of the new real-sales record represents growth achieved only recently after a roughly five-year period of stagnation.
August Retail Sales: Nominal vs. Real
| Metric | August 2026 | Comparison |
| Nominal retail sales | +1.2% m/m | +0.8% expected |
| Retail control group | +1.4% m/m | +0.5% expected |
| Real retail sales | +0.8% m/m | Inflation-adjusted |
| Real retail sales | +2.6% y/y | Inflation-adjusted |
| Real sales vs. Apr. 2021 | +1.4% | Over ~5.3 years |
| Real sales level | ~$231B | 1982–84 CPI-adjusted dollars |
The difference between nominal and real growth is important. Retail sales measured by the Census Bureau represent current dollars, while FRED's RRSFS series divides those sales by CPI to estimate changes after consumer-price inflation. FRED describes the series as Advance Retail and Food Services Sales (RSAFS) deflated by CPI-U (CPIAUCSL).
Five Years of Almost No Real Growth
The August record looks considerably weaker when compared with April 2021.
April 2021 → August 2026
- Real retail sales: +1.4%
- Elapsed time: ~5 years 4 months
- Approximate annualized real growth: ~0.26% per year
In other words, real retail spending grew at an average rate of only about one-quarter of one percent annually over that period.
That contrasts sharply with the pre-pandemic trend visible in the FRED series.
From the chart:
- Mid-2009: ~$155B
- Early 2020: ~$200B
- Pandemic low: ~$157B
- Early 2021: ~$225–230B
- August 2026: ~$231B
Between 2009 and early 2020, inflation-adjusted retail sales increased by roughly 29%. Since the 2021 surge, the series has largely moved sideways.
The 2020–21 Distortion
The chart shows three distinct periods.
2009–2019: relatively steady real-sales expansion from approximately $155 billion to $200 billion.
2020–early 2021: an unprecedented collapse followed by an equally unusual rebound. Real sales fell toward $157 billion during the initial pandemic shock before surging above $225 billion.
2021–2026: a broad plateau. Most observations fall roughly between $218 billion and $230 billion, despite nominal consumer spending continuing to rise.
The latest reading finally pushes the series above that range.
The important distinction is between a record level and a strong growth trend.
August produced both a new record and strong short-term growth. But the longer-term series shows that real retail spending has gained only 1.4% since April 2021.
August Was Still a Strong Month
The long-term stagnation does not negate the strength of the latest report. July's real-sales level was 229,439 million CPI-adjusted dollars, down 0.7% from June's 230,952 million. July real sales were only 1.7% higher year over year.
August therefore represents a meaningful acceleration:
| July | August | |
| Real sales m/m | -0.7% | +0.8% |
| Real sales y/y | +1.7% | +2.6% |
| Nominal retail sales m/m | -0.6% initially reported | +1.2% |
The shift from -0.7% to +0.8% is a 1.5-percentage-point change in the monthly rate at which inflation adjusted sales grow. The first report from the Census Bureau for July is that nominal sales are $763.6 billion. It is a 0.6% decrease from the previous month - but the amount is 5.0% higher than the sales in July 2025.
What the Inflation Adjustment Actually Tells Us
FRED's real-sales measure is calculated as:
Nominal Retail & Food Services Sales ÷ CPI-U
It is therefore useful for separating growth in dollars spent from growth after general consumer-price increases.
The August numbers illustrate the difference directly:
- Nominal sales: +1.2% m/m
- Real sales: +0.8% m/m
- Difference: ~0.4 percentage point
But the gap becomes much more important over several years. Nominal sales have risen substantially since 2021, while inflation-adjusted sales are only modestly above their April 2021 level.
This supports Antoni's narrower point: record nominal spending and even a record real-sales level do not by themselves imply strong cumulative real consumption growth since 2021.
What It Means for Retailers
For retailers, the data separate revenue growth from volume growth.
A company can report materially higher dollar sales than in 2021 while selling only modestly more goods in inflation-adjusted terms. That matters for:
- Revenue: higher prices can lift reported sales even with weak volume growth.
- Inventory: stagnant real demand reduces the need for aggressive unit expansion.
- Margins: price-driven revenue growth does not automatically translate into stronger margins if wages, rent, logistics and input costs also rise.
- Forecasting: August's +0.8% real increase is stronger than the post-2021 trend, but one month does not establish a new trend.
The latest data therefore tell two different stories depending on the time horizon: August was a strong month, but the post-2021 real retail expansion remains unusually small.
Technical Note
The chart displays the Advance Real Retail & Food Services Sales (RRSFS) from the FRED series. It is a monthly record that the Census Bureau adjusts for seasonal patterns. The data are expressed in millions of dollars based on the consumer price index from 1982 - 1984. FRED creates this series - combining the Advance Retail or Food Services Sales from the Census Bureau with the CPI-U. On some occasions, government officials revise the initial figures. There is a possibility that the current data will change in the future.
 Artem Voloskovets