Victoria Bazir

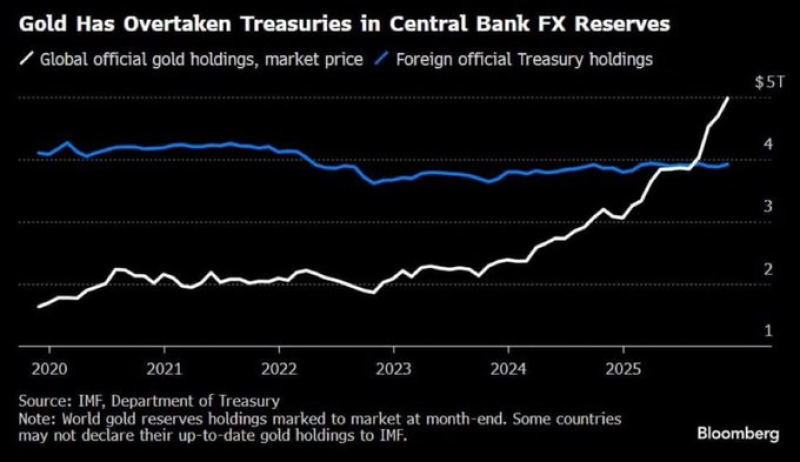
Central banks' gold holdings have climbed to roughly $5 trillion in market value, pushing past foreign official holdings of U.S. Treasuries for the first time on record, according to a chart shared by Hedgeye citing IMF and U.S. Department of Treasury data. The shift marks a structural change in how the world's central banks store their reserves, ending Treasuries' long run as the dominant reserve asset.
The Numbers Behind the Shift
The chart, sourced from Bloomberg using IMF and Treasury figures, tracks two lines from 2020 through 2026. Global official gold holdings, marked to market price, started near $1.5 trillion in 2020, dipped slightly through 2022, and then rose sharply from 2023 onward, breaking through the $2 trillion, $3 trillion and $4 trillion marks in succession before reaching roughly $5 trillion by late 2025 or early 2026. Foreign official Treasury holdings, by contrast, hovered in a narrow band between roughly $3.5 trillion and $4 trillion for the entire six-year period, showing almost no growth over the timeframe covered.
The gap between the two lines closed steadily over 2024 and 2025, with gold's line crossing above the Treasury line late in the chart's timeline. The note attached to the chart flags that not all countries report up-to-date gold holdings to the IMF, meaning the true scale of the shift could be even larger than the reported figures suggest.
Gold vs. Treasuries: The Comparison
Comparing the two assets side by side highlights how different their trajectories have been. Treasury holdings by foreign officials essentially plateaued for six years, moving in a tight range with no clear upward trend, reflecting steady but unexciting demand from central banks that traditionally parked reserves in U.S. government debt. Gold holdings, on the other hand, more than tripled in market value terms over the same stretch, moving from roughly $1.5 trillion to about $5 trillion.
Below is a simplified read of the two series taken from the chart at key points along the timeline: 2020 saw gold near $1.5T versus Treasuries near $4T; 2023 saw gold around $2T versus Treasuries around $3.5T; and by late 2025 into 2026, gold reached roughly $5T while Treasuries remained near $3.8T to $4T. That progression shows gold not just catching up but decisively overtaking Treasuries as the reserve asset of choice, at least by market value.
What This Means for the Industry
The central banks act to change their strategy so that they do not depend mostly on debt from the United States government for their primary reserve assets - those organizations that buy gold at an even rate own an asset with a price that increased significantly - but the organizations that keep their holdings in Treasuries experience a total value of reserves that remains almost the same during the time on the graph. In this situation, the shift shows that the banks choose to hold many different types of assets. There is a benefit for the banks that choose gold. It is a period where the market value of Treasuries does not grow - those institutions change how they manage their wealth to avoid risks.
For the U.S. government and Treasury market, the milestone raises questions about future demand from foreign official buyers, a group that has historically been a major source of financing. For the gold market, it underscores sustained official-sector buying as a structural demand driver, a trend that bullion investors, miners and traders will likely watch closely as the two lines on the chart continue to diverge.
 Victoria Bazir